Project status reports often get treated as a necessary evil—something teams grudgingly produce to satisfy management requests. But here’s what many organizations miss: when done right, these reports become one of your most powerful project management tools.
The reality is that most companies still approach reporting in chaotic or outdated ways. Teams scramble to compile information from scattered sources, create inconsistent formats that confuse stakeholders, and spend hours on manual updates that could be automated. Meanwhile, projects drift off course because the right information isn’t reaching decision-makers at the right time.
Expert project management bodies consistently emphasize that organizations using regular status reports are much more likely to achieve their project objectives. The difference between successful and struggling projects often comes down to transparency and communication—exactly what effective status reporting provides.
This guide will help you understand what makes a project status report valuable, how to create reports that actually drive action, and which project status reports examples and tools can streamline the entire process. We’ll cover everything from basic report components to advanced automation using Microsoft 365 tools, plus show you how modern project management solutions can eliminate much of the manual work while improving report quality.
| Key takeaway | Stat | Source |
| Teams see a major lift in internal comms with project management tools (2024) | 77% | 2024 Project Management Survey |
| Internal project wins get a strong boost from using these tools (2024) | 64% | 2024 Project Management Survey |
| Momentum continues—more project wins reported with these tools (2025) | 59% | 2025 Project Management Survey |
| Client-facing projects thrive when powered by project management platforms | 64% | 2024 Project Management Survey |
| Adopting proven PM practices slashes wasted spend on key initiatives | by 28x | 2017 PMI’s Pulse |
What Is a Project Status Report, and Why Do You Need One?
A project status report is a regular document that captures the current state of a project at a specific point in time. Think of it as a snapshot that shows how far you’ve progressed, which tasks are complete, what’s currently in motion, and where potential problems might be lurking.
These reports track the essential elements that determine project success: progress against milestones, resource utilization, budget status, timeline adherence, and emerging risks. A well-constructed status report answers the fundamental questions every stakeholder has: Are we on track? What’s been accomplished? What obstacles are we facing? What decisions need to be made?
The format can vary widely depending on your needs. Some teams prefer detailed text documents with tables and charts. Others use visual dashboards that display key metrics at a glance. Many organizations now integrate reporting directly into their project management systems, creating live updates that reflect real-time progress.
Project status reports serve several critical functions that go beyond simple documentation:
- Internal control and course correction. For project managers, these reports provide a structured way to assess whether the project remains aligned with its goals. Regular reporting creates natural checkpoints where you can identify deviations early and adjust your approach before small issues become major problems.
- Stakeholder communication and transparency. Clear, consistent reporting keeps everyone informed about project progress. This is especially valuable when working with clients, executives, or cross-functional teams who need visibility but aren’t involved in day-to-day execution. Transparency builds trust and reduces the likelihood of last-minute surprises.
- Risk identification and management. The process of creating status reports forces teams to regularly evaluate potential risks and current blockers. This systematic approach to risk assessment often catches issues that might otherwise be overlooked until they impact delivery.
- Data-driven decision making. Management can use report insights to make informed decisions about resource allocation, timeline adjustments, or priority changes. Having consistent data makes it easier to compare options and understand the implications of different choices.
Status reporting becomes particularly valuable for large projects or distributed teams where coordination and alignment require deliberate effort. When team members work across different locations, time zones, or departments, regular reporting creates a shared understanding of progress and priorities.
Main components of a project status report
Effective project status reports share common structural elements that make them useful for both creators and readers. While the specific format may vary based on your project’s complexity and audience needs, these core components provide a foundation for comprehensive reporting:
- General project information establishes context for the entire report. This section includes the project name, reporting period, project manager’s name, and current phase or stage. Adding a brief project description helps orient readers who may be reviewing multiple projects or joining the conversation mid-stream.
- Task completion status forms the operational heart of most reports. This section lists key tasks with their current status—completed, in progress, blocked, or delayed. Include the person responsible for each task, progress percentage when relevant, and brief comments explaining any significant developments. This information helps readers understand not just what’s happening, but who’s accountable for results.
- Milestones and deadlines provide the timeline perspective that stakeholders need for planning and coordination. Document completed milestones, upcoming deadlines, and any schedule changes that have occurred. When deadlines slip, explain the reasons and outline your adjustment plan. This proactive communication prevents confusion and helps stakeholders make informed decisions about dependent activities.
- Risks and issues represent one of the most critical sections for project success. Research indicates that projects with high stakeholder engagement have a 78% success rate, compared to just 40% for those with low engagement—and transparent risk communication is a key driver of that engagement. Document identified risks that could impact schedule, budget, or quality. Include risk severity, current status, potential consequences, and recommended response actions.
- Resource utilization tracks both human and financial resources against your project plan. Show actual spending versus budget, team capacity and workload, equipment or tool usage, and any requests for additional resources. This information helps management understand resource needs across projects and make allocation decisions.
- Comments and recommendations tie everything together with analysis and forward-looking guidance. Provide an overall assessment of project health, specific recommendations for management or stakeholders, and preview of priorities for the next reporting period. This section transforms raw data into actionable insights.
This structure creates a logical flow that allows readers to quickly assess project status and identify areas requiring attention. Even readers without deep project knowledge can navigate the report efficiently and understand key issues. The consistent format also makes it easier to compare progress across reporting periods and identify trends that might not be obvious from individual updates.
| KPI | What it measures | How to calculate | Ideal range |
| Schedule Performance Index (SPI) | Timeline adherence | Earned Value / Planned Value | 0.95 – 1.05 |
| Cost Performance Index (CPI) | Budget efficiency | Earned Value / Actual Cost | 0.95 – 1.05 |
| Milestone Completion Rate | Progress against checkpoints | Completed Milestones / Total Milestones × 100 | 85% – 100% |
| Risk Mitigation Rate | Risk management effectiveness | Resolved Risks / Total Identified Risks × 100 | 70% – 90% |
| Team Velocity | Work completion rate | Story Points Completed / Sprint Duration | Consistent trend |
👉What is a project progress report, and how does it differ from a project status report? A project progress report is a forward-looking document that focuses specifically on measuring advancement toward project goals and milestones, typically emphasizing completed work, performance metrics, and trajectory toward final deliverables. While project status reports provide a comprehensive snapshot of the current project state including risks, issues, resources, and team dynamics, progress reports are more narrowly focused on quantifying how much work has been accomplished and what remains to be done. Progress reports tend to be more metric-driven and performance-oriented, while status reports offer broader situational awareness for stakeholders. Both serve important but distinct communication purposes, with progress reports answering “how far have we come?” and status reports answering “where do we stand overall?” That said, these terms are often used interchangeably.
Main Types of Project Status Reports
Project status reports aren’t one-size-fits-all documents. The most effective reports are tailored to their intended audience, reporting frequency, and the specific information needs of your project stakeholders. Understanding the different types helps you choose the right approach and avoid overwhelming busy executives with operational details or leaving project teams without the information they need.
By level of detail
Standard reports serve as the workhorse of project communication, designed for regular use within project teams and with immediate stakeholders. These reports include comprehensive information about task progress, detailed timelines, current issues and their impact on the project, and resource utilization metrics.
A standard report typically contains a complete list of activities with status updates, thorough descriptions of current challenges and how they affect project delivery, completion forecasts with supporting rationale, and specific action items for team members. This level of detail proves invaluable for project managers and team members who need to coordinate work and make operational decisions.
Executive project status reports take a fundamentally different approach, focusing on strategic insights rather than operational details. These concise reports help senior management quickly assess project health, identify risks requiring executive attention, and make necessary strategic decisions without getting lost in implementation specifics.
Executive reports emphasize the big picture through achieved milestones and progress on key performance indicators, summary of risks and issues that need top-level decisions, brief recommendations or resource requests that require approval, and clear visual indicators of project health. These reports frequently use RAG status indicators—red for problems requiring immediate attention, amber for risks that need monitoring, and green for projects tracking well against plan.
The visual presentation becomes especially important for executive audiences. Charts, graphs, and color-coded status indicators help busy leaders absorb information quickly during meetings or brief review sessions.
By frequency
Weekly reports work best for intensive projects with high dynamics and frequent changes. These reports help teams maintain momentum, catch problems early, and adjust course quickly when circumstances change. Weekly reporting proves particularly valuable during critical project phases, when working with tight deadlines, or managing distributed teams that need regular coordination.
The challenge with weekly reporting lies in maintaining quality while managing the time investment. Teams need efficient data collection processes and streamlined formats to make weekly reporting sustainable over extended periods.
Monthly and quarterly reports suit projects with more stable paces and longer-term milestones. These reports focus on broader trends, accumulated results, and strategic adjustments rather than week-to-week tactical changes. Monthly reports often go to department heads, clients, or steering committees who need regular updates but don’t require detailed operational information.
Quarterly reports typically serve portfolio management purposes, helping organizations track progress across multiple projects and make resource allocation decisions. These reports often include budget variance analysis, milestone achievement rates, and strategic alignment assessments.
One-time status reports address specific situations that require comprehensive project documentation. Teams typically create these reports when projects reach major milestones, transfer between teams or contractors, undergo audits or reviews, or reach completion.
One-time reports often include historical context that regular reports assume readers already understand. They document the entire project journey, major decisions and changes, lessons learned, and recommendations for future similar projects.
| Project characteristics | Recommended frequency | Report type | Key focus areas |
| High-risk, tight deadlines | Weekly | Operational | Task completion, blockers, resource needs |
| Standard business projects | Bi-weekly | Standard | Milestones, budget, risks, team capacity |
| Long-term initiatives | Monthly | Strategic | Progress trends, strategic alignment, ROI |
| Portfolio oversight | Quarterly | Executive | Portfolio health, resource allocation, strategic outcomes |
| Project transitions | One-time | Comprehensive | Complete project history, lessons learned, handover |
By format
Text documents remain popular for formal reporting, especially when reports need approval, archival, or distribution outside your immediate project management system. Most text-based reports use Word or PDF formats with structured sections, embedded tables and charts, and professional formatting suitable for client or executive distribution.
Text documents work well when you need to provide detailed explanations, include extensive background information, or create reports that stakeholders can easily annotate and share. However, they require more manual effort to create and update compared to automated alternatives.
Visual reports leverage charts, graphs, and infographics to communicate project status more efficiently than text alone. These reports often include progress tables, Gantt charts showing timeline status, KPI dashboards with key metrics, and RAG indicators for quick status assessment.
Visual reports excel in presentation settings or when communicating with stakeholders who prefer graphical information. PowerPoint presentations and interactive spreadsheets commonly serve this purpose, though many project management tools now generate visual reports automatically.
Interactive reports represent the most sophisticated approach, created within specialized project management systems like Microsoft Project, Jira, Asana, or Monday.com. Interactive reports allow stakeholders to track task status in real time, add comments and updates as work progresses, and access different views of the same underlying data based on their role and information needs.
Interactive reporting proves especially valuable for distributed teams practicing agile methodologies. Team members can update task status, log time, and communicate about blockers directly within the system, ensuring that reports always reflect current reality rather than outdated snapshots.
The choice between these formats often depends on your organization’s technology infrastructure, stakeholder preferences, and the level of detail required for effective project management.
👉Learn more about project management in our dedicated guides on the topic:
- Project Management Team Guide: Roles, Structure, Tool & Tips
- How to Build and Use a Project Management Timeline: Tips and Examples
- Project Management Calendar: Your Guide to Planning Projects Efficiently
- Efficient Multiple Project Management with Kanban: An Expert Guide
- The Digital Project Manager’s Playbook: Essential Skills, Tools, and Tactics
- Understanding the Role of a Project Manager in Marketing
How to Write a Project Status Report: A Step-by-Step Guide
Creating an effective project status report requires more than filling out a template. The best reports combine accurate data collection with clear communication and strategic thinking. This systematic approach helps you produce reports that actually drive action rather than simply documenting activity.
Preparing the data
Quality reporting starts with quality data, which means establishing reliable sources and consistent collection processes before you begin writing.
Collecting information on current task status forms the foundation of accurate reporting. Review each major task and deliverable to determine completion status, current progress percentage, blockers or impediments affecting work, and realistic completion estimates based on current conditions.
Avoid the temptation to rely solely on team member estimates without verification. Check actual deliverables, review completed work quality, and validate progress claims against measurable outputs. This verification process helps prevent the optimistic bias that often creeps into self-reported progress updates.
Analyzing deadlines and milestones requires comparing planned versus actual progress across your project timeline. Identify which deadlines you’ll meet comfortably, which require additional effort or resources, and which need realistic adjustments. When delays occur, dig into root causes rather than simply documenting the schedule slip.
Understanding why deadlines shift helps you make better predictions about future milestones and identify systemic issues that might affect other project areas. Document both the immediate impact and potential downstream effects of any timeline changes.
Assessing issues and risks involves systematic evaluation of current problems and potential future challenges. Current issues need immediate attention and clear resolution plans. Emerging risks require probability assessment and mitigation strategies before they become active problems.
Expert project management research emphasizes that effective reports prioritize risks, dependencies, and blockers over simple activity lists. The main purpose is escalating issues and highlighting accomplishments, not detailing every week-to-week task.
Using reliable data sources ensures your reports reflect project reality rather than outdated information or assumptions. Pull data from your CRM systems for customer interaction history, project management tools like Jira, Microsoft Planner, or Asana for task status, regular team meetings and one-on-ones for qualitative insights, and email or chat communications for stakeholder feedback and requirements changes.
Establish regular data collection routines so information gathering doesn’t become a last-minute scramble before report deadlines. Many successful project managers dedicate specific time slots each week to updating project data and reviewing team progress.
Report structure
A logical, consistent structure makes your reports easier to write and more valuable for readers. This framework ensures you cover essential information without overwhelming stakeholders with unnecessary details:
- Header information should include project name, reporting period covered, report author and contact information, current project phase or sprint, and distribution list for transparency about who receives the report.
- Executive summary provides the essential information that busy stakeholders need most. Limit this section to three or four paragraphs covering current project health and trajectory, major accomplishments since the last report, critical issues requiring stakeholder attention, and overall team morale and capacity.
This summary serves readers who may not have time for detailed review but need to understand project status for decision-making purposes. Write it last, after completing the detailed sections, to ensure accuracy and completeness.
- Detailed status of tasks and activities translates project work into understandable progress updates. List major tasks with clear status indicators: completed tasks with delivery dates, in-progress tasks with completion percentages and expected finish dates, and blocked tasks with explanations of impediments and resolution plans.
Include task owners and brief progress comments that provide context beyond simple percentages. Instead of “Task is 75% complete,” explain what specific work has been finished and what remains.
- Key metrics and status indicators help readers quickly assess project health without analyzing detailed task lists. Use consistent visual signals throughout your reporting: green for on-track activities, yellow for at-risk items requiring attention, and red for off-track elements needing immediate intervention.
Effective status reports are metric-driven and incorporate KPIs to provide quantifiable measures of project health. Essential metrics include Schedule Performance Index, indicating timeline adherence, Cost Performance Index, measuring financial efficiency, milestone completion rates, tracking progress against key checkpoints, and risk status, quantifying identified threats and mitigation progress.
- Project changes document significant modifications that affect scope, timeline, budget, or team composition. Explain the rationale behind changes and their impact on project delivery. This documentation prevents confusion and provides historical context for future reference.
- Next period plan creates accountability and sets expectations for upcoming work. Outline key priorities for the next reporting period, major milestones or deliverables expected, resource requirements or dependencies, and any decisions needed from stakeholders.

👉 So, how do you write a project status report? To write a project status report, start by gathering current data from reliable sources like your project management tools, team updates, and stakeholder feedback, then organize the information using a consistent structure that includes header details, an executive summary, task progress, risks and issues, resource utilization, and next steps. Focus on clarity and conciseness and tailor the content and detail level to your audience—executives need high-level insights and decision points, while project teams require operational specifics. The key is transforming raw project data into actionable insights that drive informed decision-making rather than simply documenting activities.
Tips and best practices
These practical guidelines help transform basic reporting skills into communication excellence. Following proven best practices ensures your reports get read, understood, and acted upon rather than ignored or misinterpreted:
- Keep reports concise without sacrificing essential information. Shorter, well-structured reports get read and acted upon more frequently than lengthy documents that intimidate busy readers. Focus on information that drives decisions rather than comprehensive activity documentation.
- Use visualization to make complex information more accessible. Include progress charts showing completion trends, status tables with color coding for quick scanning, and graphs illustrating key performance metrics. Visual elements help readers absorb information quickly during meetings or brief review sessions.
- Consider your audience when determining detail level and technical language. Team reports can include operational specifics and technical terminology that would confuse executive audiences. Client reports need different emphasis than internal stakeholder updates. Tailor content and format to match reader needs and expertise levels.
- Automate repetitive elements to reduce manual effort and improve consistency. Many project management tools generate status summaries automatically from task data. Template-driven reporting ensures consistent format while reducing preparation time.
Automation works best for data compilation and formatting, while human insight remains essential for analysis, context, and recommendations. Use technology to eliminate busy work so you can focus on strategic communication and problem-solving.
👉What is a status report? A status report is a structured communication document that provides a snapshot of current conditions, progress, and key information about a project, initiative, or organizational area at a specific point in time. It serves as a formal mechanism for keeping stakeholders informed about what’s happening, what’s been accomplished, what challenges exist, and what’s planned for the immediate future. Status reports typically follow a consistent format and schedule, making it easy for readers to quickly understand the current state of affairs and identify areas that need attention or decision-making. They function as both accountability tools and information-sharing vehicles that help organizations maintain transparency, coordinate efforts, and ensure everyone stays aligned on priorities and progress.
Project Status Report Examples and Templates
Ready-made project status reporting templates provide a foundation for consistent, professional reporting while saving time that would otherwise be spent creating report structures from scratch. These templates can be adapted to match your project’s specific needs and stakeholder requirements, ensuring that critical information gets communicated effectively every time.
| Template type | Best for | Key sections | Update frequency | Audience level |
| Weekly Operational | Active projects, team coordination | Tasks, blockers, immediate needs | Weekly | Project team, direct managers |
| Monthly Strategic | Regular business updates | Milestones, budget, risks, trends | Monthly | Department heads, stakeholders |
| Executive Dashboard | Senior leadership reporting | KPIs, health indicators, decisions needed | Monthly/Quarterly | C-level, board members |
| Agile Sprint | Scrum/Kanban teams | Velocity, burndown, retrospective | Per sprint | Product owners, scrum masters |
| Project Closure | Project completion | Full history, outcomes, lessons learned | One-time | All stakeholders, future teams |
Project status report template
The standard project status report template serves as the backbone for regular team communication and stakeholder updates. This comprehensive format captures all essential project information while maintaining readability and logical flow.
The basic template structure balances thoroughness with usability, providing enough detail for informed decision-making without overwhelming readers with unnecessary complexity. Here’s a practical template you can customize for your projects:
| Section | Content | Purpose |
| Header | Project Name: [Project Name] Reporting Period: [Start Date] – [End Date] Project Manager: [Name] Report Date: [Date] Current Phase: [Phase/Sprint Name] | Establishes context and accountability |
| Executive Summary | • Overall Status: [Green/Yellow/Red] • Key Accomplishments: [2-3 bullet points] • Major Issues: [Brief description] • Team Morale: [High/Medium/Low with brief explanation] | Provides quick overview for busy stakeholders |
| Task Status | Task Name | Owner | Status | Progress % | Due Date | Comments [Task 1] | [Name] | In Progress | 65% | [Date] | [Brief update] [Task 2] | [Name] | Completed | 100% | [Date] | [Delivery notes] [Task 3] | [Name] | Blocked | 30% | [Date] | [Blocker description] | Tracks individual deliverable progress |
| Milestones | Milestone | Target Date | Actual Date | Status | Notes [Milestone 1] | [Date] | [Date] | Complete | [Any variance notes] [Milestone 2] | [Date] | TBD | On Track | [Progress notes] | Monitors key project checkpoints |
| Risks & Issues | Risk/Issue | Probability | Impact | Status | Mitigation Plan [Risk 1] | Medium | High | Active | [Response strategy] [Issue 1] | N/A | Medium | Open | [Resolution plan] | Manages threats to project success |
| Resources | Budget: $[Used] of $[Total] ([%] utilized) Team Capacity: [Available hours] / [Total hours] Additional Needs: [Resource requests] | Tracks resource utilization |
| Next Steps | • [Priority 1 for next period] • [Priority 2 for next period] • [Priority 3 for next period] • Decisions Needed: [List stakeholder decisions required] | Sets expectations for upcoming work |
You can find downloadable versions of this template in multiple formats. Microsoft 365 users can access Word and Excel templates through the template gallery. Project management platforms like Asana, Trello, and Jira offer exportable report formats that follow similar structures. Google Docs provides collaborative templates that teams can customize and share easily.
💡 For teams using Microsoft 365, consider integrating templates with Virto Kanban Board App or Virto Gantt Chart App, which can automatically populate task status and progress data, reducing manual entry while ensuring accuracy.
Executive project status report template
Executive reports require a fundamentally different approach, condensing complex project information into concise, decision-focused summaries. These reports typically span one to two pages maximum and emphasize visual indicators over detailed explanations.
| Section | Content | Executive Focus |
| Project Overview | Project: [Name] | Period: [Dates] | PM: [Name] Status: 🟢 On Track / 🟡 At Risk / 🔴 Off Track Budget: [% Used] | Timeline: [% Complete] | Scope: [Status] | Quick health assessment |
| Key Metrics Dashboard | Schedule Performance Index: [Value] Cost Performance Index: [Value] Milestone Completion: [X of Y complete] Team Velocity: [Trending up/down/stable] | Quantifiable measures for executive reporting |
| Critical Items | Decisions Needed: • [Decision 1 with deadline] • [Decision 2 with deadline] Major Risks: • [Risk 1]: [Impact] – [Mitigation] • [Risk 2]: [Impact] – [Mitigation] | Focus on executive action items |
| Accomplishments | • [Major deliverable completed] • [Key milestone achieved] • [Significant risk resolved] | Highlight strategic progress |
| Resource Requests | • Additional Budget: [Amount for what purpose] • Personnel: [Roles needed and timeline] • Authority: [Approvals needed] | Clear asks with justification |
| Outlook | Next 30 Days: [Key activities] Success Factors: [What needs to happen] Confidence Level: [High/Medium/Low with brief rationale] | Forward-looking perspective |
Visual elements become particularly important for executive audiences. Use color indicators consistently throughout the report—green for items proceeding normally, yellow for items requiring attention, and red for critical issues. Include mini charts showing budget burn rate, timeline progress, or team capacity trends when relevant.
💡 Consider creating dashboard-style presentations using PowerPoint or Power BI for executive meetings, where interactive elements allow leaders to drill down into specific areas of interest during discussions.
Agile project status report template
Agile environments require reports that reflect iterative development cycles and emphasize team velocity, sprint progress, and impediment removal. These reports typically cover shorter time periods but provide more frequent communication cycles.
| Section | Content | Agile Focus |
| Sprint Summary | Sprint: [Number/Name] | Duration: [Start] – [End] Sprint Goal: [Primary objective]Team: [Team name] | Scrum Master: [Name] | Sprint-specific context |
| Velocity & Burndown | Planned Story Points: [Number] Completed Story Points: [Number] Team Velocity: [Current] vs [Average] Burndown Status: [Ahead/On Track/Behind] | Agile-specific metrics for tracking work completion rate |
| User Story Status | Story | Points | Status | Owner | Notes [Story 1] | [Points] | Done | [Name] | [Acceptance criteria met][Story 2] | [Points] | In Progress | [Name] | [Current status][Story 3] | [Points] | Blocked | [Name] | [Impediment details] | Individual story tracking |
| Impediments | Active Blockers: • [Impediment 1]: [Impact] – [Resolution owner]<br> • [Impediment 2]: [Impact] – [Resolution owner] Resolved This Sprint: • [Resolved impediment]: [How resolved] | Focus on removing obstacles |
| Sprint Retrospective | What Went Well: • [Success 1] • [Success 2] Areas for Improvement: • [Improvement 1] • [Improvement 2] Action Items: • [Action 1]: [Owner] • [Action 2]: [Owner] | Continuous improvement focus |
| Next Sprint Preview | Upcoming Sprint Goal: [Objective] Planned Stories: [High-level preview] Team Capacity: [Available points/hours] Dependencies: [External dependencies to monitor] | Forward planning |
One-time status report template
Comprehensive one-time reports serve project transitions, audits, or final documentation needs. These reports provide complete project history and context that regular reports assume readers already understand.
| Section | Content | Comprehensive Coverage |
| Project Summary | Project Name: [Name] Business Case: [Original justification] Start Date: [Date] | End Date: [Date] Total Duration: [Timeframe]Final Budget: [Amount] | Variance: [+/- Amount] | Complete project overview |
| Scope & Deliverables | Original Scope: • [Deliverable 1]: [Status/Quality] • [Deliverable 2]: [Status/Quality] Scope Changes: • [Change 1]: [Rationale and impact] • [Change 2]: [Rationale and impact] | Scope management history |
| Timeline Analysis | Major Milestones: Milestone | Planned Date | Actual Date | Variance [Milestone 1] | [Date] | [Date] | [Days +/-] Critical Path Analysis: • [Major delays and causes] • [Schedule recovery actions taken] | Timeline performance review |
| Resource Utilization | Budget Performance: • Planned: [Amount] | Actual: [Amount] | Variance: [%] Team Performance: • [Role]: [Planned hours] vs [Actual hours] • [Key contributor achievements] | Resource management outcomes |
| Risk Management | Risks Realized: • [Risk 1]: [Impact and response] Risks Avoided: • [Risk 2]: [Mitigation effectiveness] Unforeseen Issues: • [Issue 1]: [How handled] | Risk management effectiveness |
| Lessons Learned | What Worked Well: • [Success factor 1] • [Success factor 2] Areas for Improvement: • [Improvement 1]: [Recommendation] • [Improvement 2]: [Recommendation] Recommendations: • [For future similar projects] • [For organizational processes] | Knowledge transfer |
Template sources include Smartsheet’s comprehensive collection in Excel, Word, and PowerPoint formats, Atlassian’s robust templates with detailed guidance, and TemplateLab and ProjectManager.com’s free template libraries. Many organizations also create custom templates within their project management systems to ensure consistency across all projects.
The key to effective templates lies in customization rather than rigid adherence to standard formats. Adapt these structures to match your project’s complexity, stakeholder needs, and organizational reporting requirements.
👉What is a project status report example? A project status report example would be a weekly update for a website redesign project that includes: the project name and reporting period, an executive summary stating the project is “on track” with 65% completion, a task breakdown showing the design phase completed and development 40% finished, upcoming milestones like user testing scheduled for next week, identified risks such as a potential delay in content delivery, budget utilization at 60% of allocated funds, and next steps including finalizing the payment gateway integration. The report would use clear visual indicators like green/yellow/red status colors and include specific owner assignments for each task, giving stakeholders a complete picture of where the project stands and what actions are needed. This type of report transforms raw project data into actionable insights that help teams stay aligned and make informed decisions about resource allocation and timeline adjustments.
Tools for Preparing and Automating Reports
The right tools can transform project status reporting from a time-consuming administrative burden into an efficient, valuable communication process. Modern project management platforms offer increasingly sophisticated automation capabilities, while specialized reporting tools provide deep analytics and visualization options.

Online platforms
The project management tool landscape offers solutions ranging from simple visual boards to comprehensive enterprise platforms. Each tool brings distinct strengths to status reporting, whether through automated dashboards, customizable templates, or integrated communication features:
- ClickUp positions itself as a comprehensive work management solution with particularly strong reporting capabilities. Its customizable dashboards feature over 50 widget variations for tracking everything from sprint velocity to workload distribution. The platform excels at automated report generation, pulling data from tasks, time tracking, and custom fields to create detailed status summaries. Teams can set up recurring reports that automatically distribute via email or Slack, ensuring stakeholders receive consistent updates without manual intervention.
The automation builder handles repetitive reporting tasks like status updates, assignment changes, and notification triggers. ClickUp’s strength lies in its flexibility—teams can create highly customized reporting workflows that match their specific processes rather than adapting to rigid template structures.
- Asana focuses on connecting daily work to strategic objectives through its Portfolios feature, which provides managers with consolidated views across multiple projects. The Universal Reporting capability tracks progress organization-wide, making it particularly valuable for executive-level status reporting. Asana’s “Rules” automation handles routine workflow tasks like routing assignments and updating custom fields based on project changes.
The platform’s clean, intuitive interface makes it easy for stakeholders to understand project status without extensive training. Dashboard customization options allow teams to highlight the metrics most relevant to their specific audiences.
- Jira remains the industry standard for software development teams using Agile methodologies. Its reporting strength lies in specialized Agile reports including burndown charts, velocity tracking, and cumulative flow diagrams. The platform’s Jira Query Language allows for precise filtering and custom report creation that can answer complex project questions.
Jira Automation provides powerful rule-building capabilities that can handle complex cross-project workflows without coding requirements. The extensive marketplace of third-party apps extends reporting capabilities for specific industry needs or integration requirements.
- Trello offers simplicity and visual clarity through its Kanban board interface. While basic reporting is limited to card counts and board activity, Power-Ups significantly extend functionality. The “Butler” automation Power-Up provides no-code workflow automation for routine tasks like moving cards, creating recurring tasks, and sending notifications.
Trello works particularly well for teams that prioritize visual project management over detailed analytics. Its community-driven template library provides starting points for virtually any project type.
- Monday.com serves as a visual “Work OS” with exceptional dashboard capabilities. Multiple widget types can pull data from different boards to create comprehensive project overviews. The intuitive automation builder creates complex, multi-step workflows that can handle sophisticated reporting requirements.
The platform’s strength lies in its visual appeal and ease of use for non-technical team members. Color-coded status indicators and progress charts make it easy for stakeholders to quickly assess project health during brief reviews.
- Notion provides ultimate flexibility through its database and page system. Teams can create completely custom reporting systems by linking databases, using rollups, and creating filtered views. While this requires more initial setup than traditional project management tools, the result can be perfectly tailored to unique organizational needs.
Notion’s collaborative editing capabilities make it excellent for reports that require input from multiple team members or ongoing stakeholder feedback.
- Smartsheet combines familiar spreadsheet functionality with robust project management features. Its real-time dashboard capabilities can pull data from multiple sheets to create portfolio-level status reports. The sophisticated workflow automation handles alerts, update requests, and conditional formatting based on project status changes.
Enterprise-level integrations with Salesforce, Microsoft 365, and Power BI make Smartsheet particularly valuable for organizations with complex technology ecosystems.
- Wrike specializes in handling project complexity with advanced analytics through its “Wrike Analyze” add-on. Custom report builders can answer specific business intelligence questions about project performance, resource utilization, and timeline adherence. The platform’s automation engine streamlines processes from task creation through final approvals.
Wrike’s integrated proofing and approval tools make it particularly strong for creative and marketing workflows where deliverable review cycles are critical.
👉Learn more about different business apps and PM solutions in our dedicated articles:
- Creative Agency Project Management Software: Features and Selection Tips
- Attendance Tracking Software: Complete Guide for Teams
- Scheduling Software for Small Business: Best Tools, Features, and How to Choose
- Marketing Calendar: Templates, Planning, Software and Management
- Streamline Your Workforce with Advanced Staff Scheduling Software
Project status reporting in Microsoft 365
Organizations already invested in the Microsoft 365 ecosystem can leverage powerful built-in tools for comprehensive project status reporting. The integrated nature of these tools creates seamless data flow between project execution and status communication.
- Single environment advantages mean that project data, team discussions, and reports exist within one cohesive system. This integration eliminates the data synchronization issues that plague multi-tool approaches. Team members can update task status in Planner, discuss issues in Teams, and automatically generate reports without manually transferring information between platforms.
- Recurring reminders and templates can be established through Outlook and Teams integration. Project managers can set up automated check-ins, deadline notifications, and report distribution schedules that work with existing calendar and communication patterns.
- Microsoft Lists and SharePoint integration provides centralized storage for project status reports with version control, approval workflows, and permission management. Teams can create custom lists that automatically populate status dashboards and roll up into executive summaries.
The power of Microsoft 365 reporting lies in its ability to connect project execution directly to organizational communication channels. Status updates can flow seamlessly from individual tasks through team discussions to executive dashboards without requiring separate tools or manual data transfer.
| Tool | Primary function | Automation level | Best use case | Learning curve |
| Power BI | Data visualization, dashboards | High | Executive reporting, KPI tracking | Medium |
| Power Automate | Workflow automation | Very High | Report generation, distribution | Medium |
| Microsoft Planner | Task management, basic reporting | Medium | Team coordination, simple status | Low |
| SharePoint Lists | Data storage, basic views | Low | Data collection, team collaboration | Low |
| Virto Kanban Board | Visual project management | High | Agile teams, visual reporting | Low |
| Virto Calendar | Schedule coordination | Medium | Timeline reporting, resource planning | Low |
👉 Learn more about project management in Microsoft:
- Microsoft Planner Alternative: Find the Best Project Management Tools for Your Team
- What Is Microsoft Loop? Features, Benefits, and How to Use It
- What Are Microsoft 365 Groups and How to Use Them
- Best Microsoft Scheduling Software for Enhanced Productivity
- Task Management for Microsoft Teams: Guide and Best Practices
- Microsoft Teams Governance for Enhanced Collaboration and Security
Project management status report template solutions
Microsoft 365 templates provide immediate starting points within familiar applications. Excel templates include pre-built sections for task summaries, milestone tracking, and risk overviews with formulas that automatically calculate completion percentages and timeline variances. Word templates offer professional formatting for client-facing reports or formal documentation requirements.
The templates integrate naturally with other Microsoft 365 applications, allowing teams to link Excel data to PowerPoint presentations or embed live charts in Word documents.
Notion templates leverage the platform’s database capabilities to create sophisticated reporting systems. Teams can build custom project databases with automatic rollups, filtered views for different audiences, and collaborative editing features. The template marketplace provides starting points for various project types, from software development to marketing campaigns.
Smartsheet templates combine spreadsheet familiarity with project management functionality. Pre-built templates include Gantt chart views, resource allocation tracking, and automated status dashboards. The templates can be customized extensively while maintaining the underlying automation and reporting capabilities.
Template adaptation remains crucial regardless of the platform. Consider your project’s specific requirements for metrics tracking, stakeholder communication needs, access level requirements, and integration with existing tools. Effective templates balance comprehensiveness with usability, providing enough structure to ensure consistency while allowing flexibility for unique project characteristics.
The most successful reporting implementations often start with standard templates and evolve based on actual usage patterns and stakeholder feedback. This iterative approach helps teams develop reporting systems that truly serve their project management needs rather than simply fulfilling documentation requirements.
How to Simplify and Automate Reporting with Microsoft 365 + VirtoSoftware
Modern project management succeeds when teams can focus on execution rather than administrative overhead. The Microsoft 365 ecosystem, enhanced with VirtoSoftware’s specialized tools, provides powerful automation capabilities that can transform project status reporting from a time-consuming task into an efficient, insight-driven process.
Visualization and task control
Virto Kanban Board App serves as the visual foundation for agile project management and automated reporting. This comprehensive tool goes beyond traditional task boards by providing advanced customization options including swimlanes, categorization, color-coding, and subtasks that create rich data sources for automated reports.
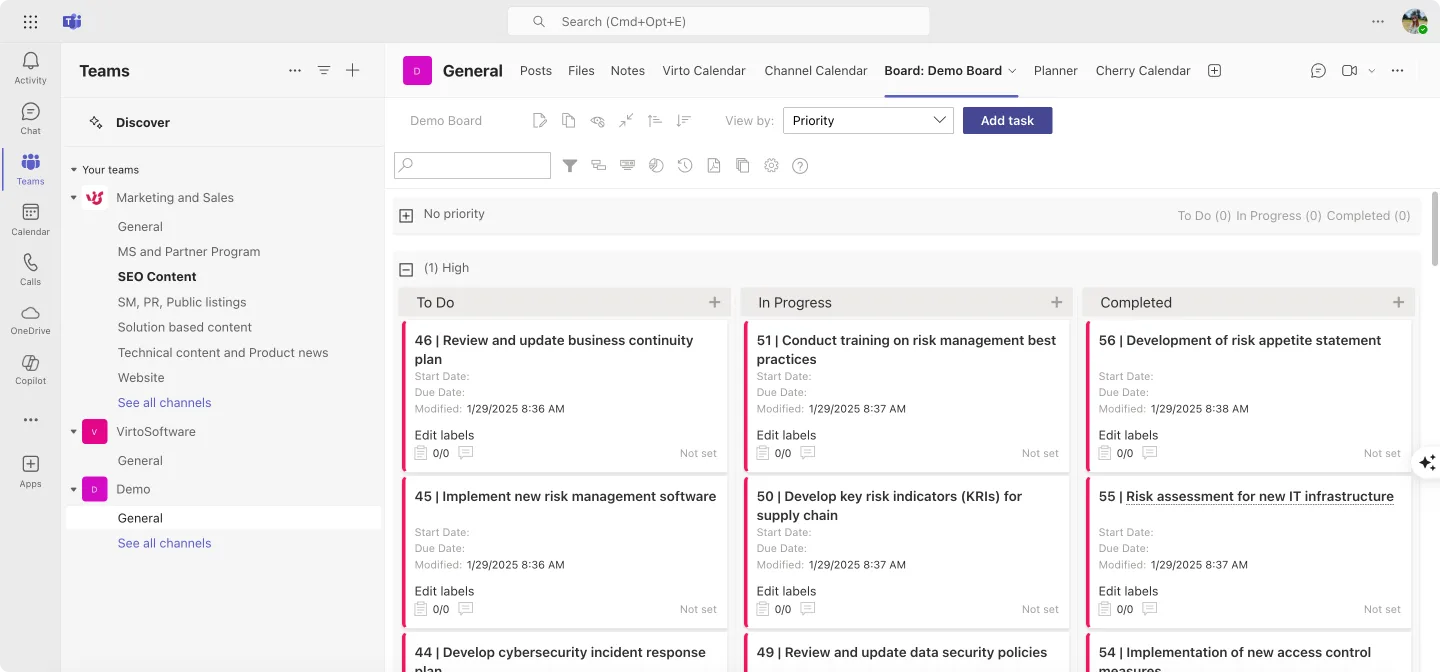
The app’s integration with SharePoint lists means that every task update, status change, and progress milestone automatically feeds into your organization’s data ecosystem. As research shows, when variances or changes are reported, it’s crucial to explain the reasons behind them to enable informed decision-making. Virto Kanban Board captures this context through detailed task histories and comment threads, ensuring your automated reports include the narrative behind the numbers.
Virto Gantt Chart App complements the Kanban approach by providing timeline-based visualization that’s essential for milestone tracking and dependency management. The app’s direct integration with SharePoint lists creates a unified data source that can automatically populate timeline reports, progress charts, and milestone completion summaries.

Both tools feature real-time updates across all platforms—SharePoint, Microsoft Teams, and mobile devices—ensuring that automated reports always reflect current project reality rather than outdated snapshots.
Check Out VirtoSoftware Solutions for Project Management

Virto Calendar
Consolidate events from SharePoint, Exchange, Google, and more into one calendar view for simplified planning.

Virto Kanban Board
Boost team productivity with Virto Kanban for Teams: a seamless, efficient task & project management tool.

Virto Kanban Board
This tool transforms team collaboration through visual task management for consistent stage-by-stage progress.
Streamlined calendar management for project coordination
Virto Calendar App centralizes scheduling across multiple data sources, making it invaluable for project timeline reporting. The app can pull events from SharePoint lists, Outlook calendars, Exchange servers, Google Calendar, and iCal sources into unified views that provide comprehensive project scheduling insights.
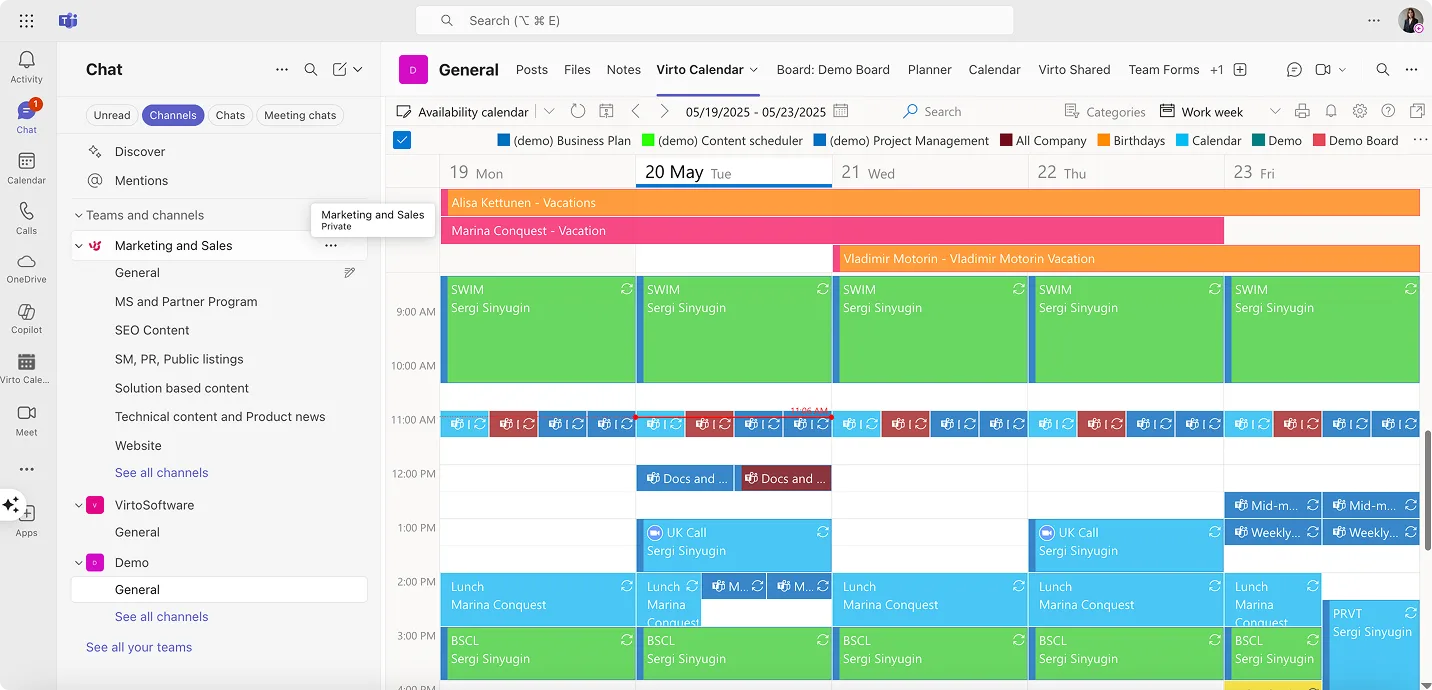
For project managers juggling multiple initiatives, Virto Calendar App’s overlay capabilities create master calendar views that show resource conflicts, milestone clustering, and deadline convergence—all essential information for executive status reports.
Virto Shared Calendar offers a lightweight alternative focused on simplicity and universal accessibility. This solution excels in scenarios where you need to share project timelines with external stakeholders like clients or vendors without requiring Microsoft accounts. The anonymous access feature makes it particularly valuable for client-facing project updates and stakeholder communication.

Key advantages include one-click event creation with color-coded tags, real-time updates across Teams and web platforms, and the ability to share calendars via simple links without authentication requirements. For project managers who need to provide timeline visibility to external parties, this eliminates the friction typically associated with stakeholder reporting.
Automation of regular reporting
Virto Alerts & Reminders App serves as the notification engine that ensures reporting deadlines are never missed and stakeholders receive timely updates. The app integrates directly with Microsoft Teams and Outlook, creating automated reminder workflows for report generation, review cycles, and distribution schedules.
Combined with Microsoft 365’s automation capabilities, this creates powerful reporting workflows. You can set up automated sequences where:
- Weekly reminders prompt team members to update task status in Virto Kanban Board
- Progress data automatically flows into Virto Calendar for timeline visualization
- Power Automate generates summary reports based on updated information
- Virto Alerts & Reminders sends distribution notifications to stakeholders
The integration extends to mobile devices, ensuring that team members receive updates and can contribute to project status regardless of their location or device.
Advanced Microsoft 365 integration benefits
The combination of VirtoSoftware tools with Microsoft 365’s native capabilities creates several automation advantages:
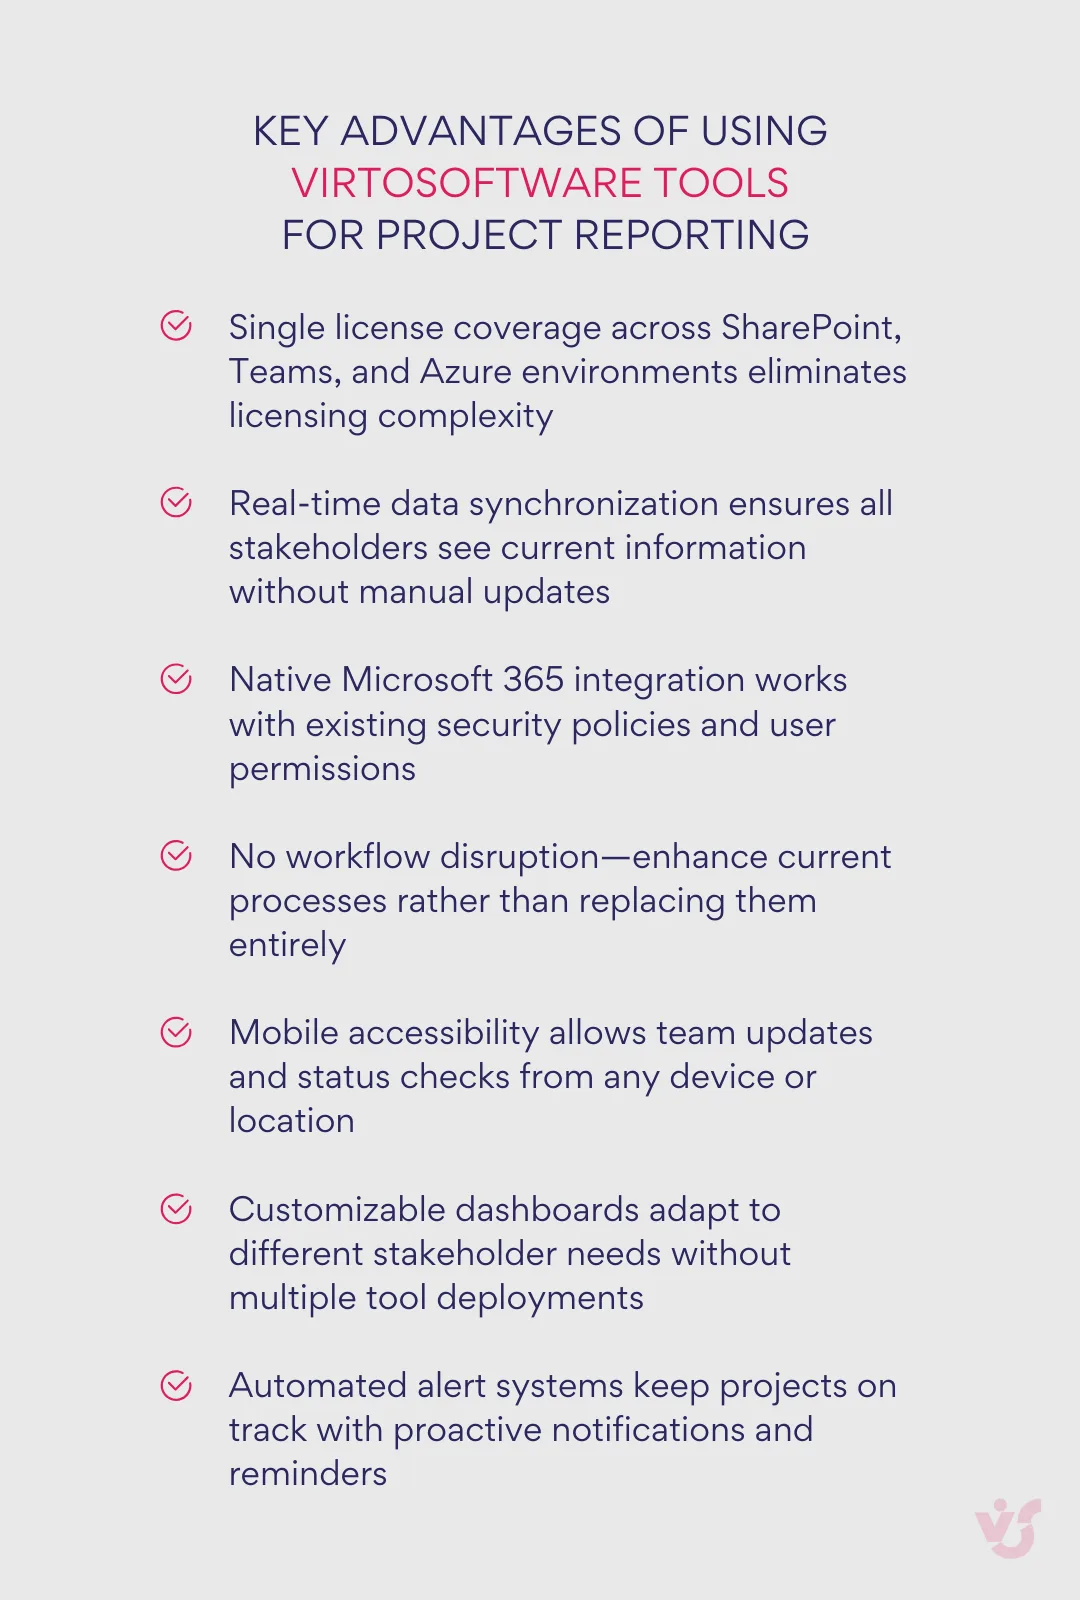
Single license simplicity means that all VirtoSoftware tools work across SharePoint, Microsoft Teams, and Azure environments without additional licensing complexity. This unified approach reduces administrative overhead and ensures consistent user experiences.
Data consistency across all platforms means that information entered in Virto Kanban Board automatically becomes available in Virto Calendar views, Gantt Chart timelines, and automated reminder systems. This eliminates the data synchronization issues that plague multi-vendor solutions.
Enhanced 2025 capabilities leverage the latest Microsoft 365 features, including the new AI-powered status reports available in Microsoft Planner that can auto-synthesize progress, milestones, risks, and next steps. VirtoSoftware tools complement these capabilities by providing the detailed task management and visualization that feeds into automated report generation.
Benefits of the integrated approach
Reduced manual effort comes from eliminating redundant data entry across multiple systems. When project information lives in SharePoint lists that power Virto Kanban boards, calendar views, and Gantt charts simultaneously, updates happen once but benefit multiple reporting views.
Minimized errors result from having single sources of truth for project data. Rather than copying information between systems or manually updating multiple tools, the integrated approach ensures consistency across all project views and reports.
Enhanced transparency emerges from having real-time dashboards and automated updates that keep all stakeholders informed without requiring manual intervention. Team members see current status, managers get automated summaries, and executives receive high-level reports—all from the same underlying data.
Scalable workflows accommodate projects of any size or complexity. Small teams can use Virto Shared Calendar for simple timeline sharing, while large enterprises can leverage the full suite of Kanban boards, Gantt charts, calendar overlays, and automated reporting to manage complex portfolios.
This integrated approach transforms project status reporting from a necessary administrative burden into a strategic communication tool that drives project success through better visibility, more informed decision-making, and enhanced team coordination.
Check Out VirtoSoftware Use Cases in Project Management

Conclusion on Status Reports in Project Management
Effective project status reporting stands as one of the most critical factors determining project success. As we’ve explored throughout this guide, organizations that implement regular, structured reporting processes are significantly more likely to deliver projects on time, within budget, and to stakeholder satisfaction. The difference between successful and struggling projects often comes down to how well teams communicate progress, identify obstacles, and maintain alignment around shared objectives.
| Phase | Timeline | Actions | Tools needed | Expected outcome |
| Assessment | Week 1 | Audit current reporting, identify pain points | Existing tools | Clear requirements document |
| Planning | Week 2 | Select tools, design workflows, create templates | VirtoSoftware trials | Implementation roadmap |
| Pilot | Week 3-4 | Test with one project, gather feedback | Virto Kanban, Calendar Apps | Validated approach |
| Rollout | Week 5-8 | Deploy across teams, train users, refine processes | Full VirtoSoftware suite | Operational system |
| Optimization | Ongoing | Monitor usage, automate workflows, expand features | Power Automate, Power BI | Mature reporting ecosystem |
A well-crafted project status report serves far more than documentation purposes—it functions as a powerful communication tool that keeps stakeholders informed, a risk management system that surfaces problems before they become crises, and a decision-making framework that enables leaders to allocate resources effectively. The most successful project managers understand that reporting isn’t about creating perfect documents; it’s about fostering transparency, accountability, and continuous improvement within their teams.
The evolution of digital project management tools, particularly within the Microsoft 365 ecosystem, has eliminated most traditional barriers to effective reporting. Modern automation capabilities can handle data collection, format generation, and distribution processes that once consumed hours of manual effort. Teams can now focus on analysis, strategy, and problem-solving rather than administrative overhead.
VirtoSoftware’s integrated suite of project management tools offers a particularly compelling solution for Microsoft 365 organizations. The beauty of these solutions lies in their ability to enhance existing workflows rather than disrupting them. Teams already using SharePoint, Teams, and other Microsoft tools can implement Virto Kanban Board App, Virto Calendar App, Virto Gantt Chart App, and Virto Shared Calendar without changing their fundamental processes or requiring extensive retraining.
This seamless integration means that project status reporting can evolve from a periodic burden into an ongoing, automated process that provides continuous visibility into project health. Real-time dashboards, automated alerts, and synchronized data across platforms create an environment where stakeholders always have access to current information, and project managers can focus on strategic guidance rather than status compilation.
For teams ready to transform their project reporting capabilities, VirtoSoftware offers multiple pathways to get started. Schedule a demo call to see these tools in action and understand how they can address your specific reporting challenges. Alternatively, download free trial versions of any VirtoSoftware applications directly from the website to explore their capabilities within your own environment.
To deepen your understanding of modern project management approaches, explore our comprehensive resources:
- Project Management Hub—Your central resource for project management best practices
- Creative Agency Project Management—Tailored solutions for creative workflows
- Agile Board Solutions—Advanced Kanban and agile management tools
- Project Management Charts—Gantt charts and timeline visualization
- Project Portfolio Management—Enterprise-level portfolio oversight
- Project Milestones—Milestone trackincticalg and management strategies
Real-world applications:
- Kanban Project Management—Pra applications of visual project management
- Team Calendar—Collaborative scheduling and coordination
- Enterprise Project Management—Large-scale project management implementations