


Virto Charts & Data Visualization Appfor Microsoft Teams
Advanced solution for optimized data visualization and efficient project management.

Key features:

SharePoint list reports inside Teams
Turn task and project lists into dashboards your team reviews in Teams, without exporting to another tool.

See who carries the most work
Team member and status charts show how tasks are spread across people.

Delays before the deadline
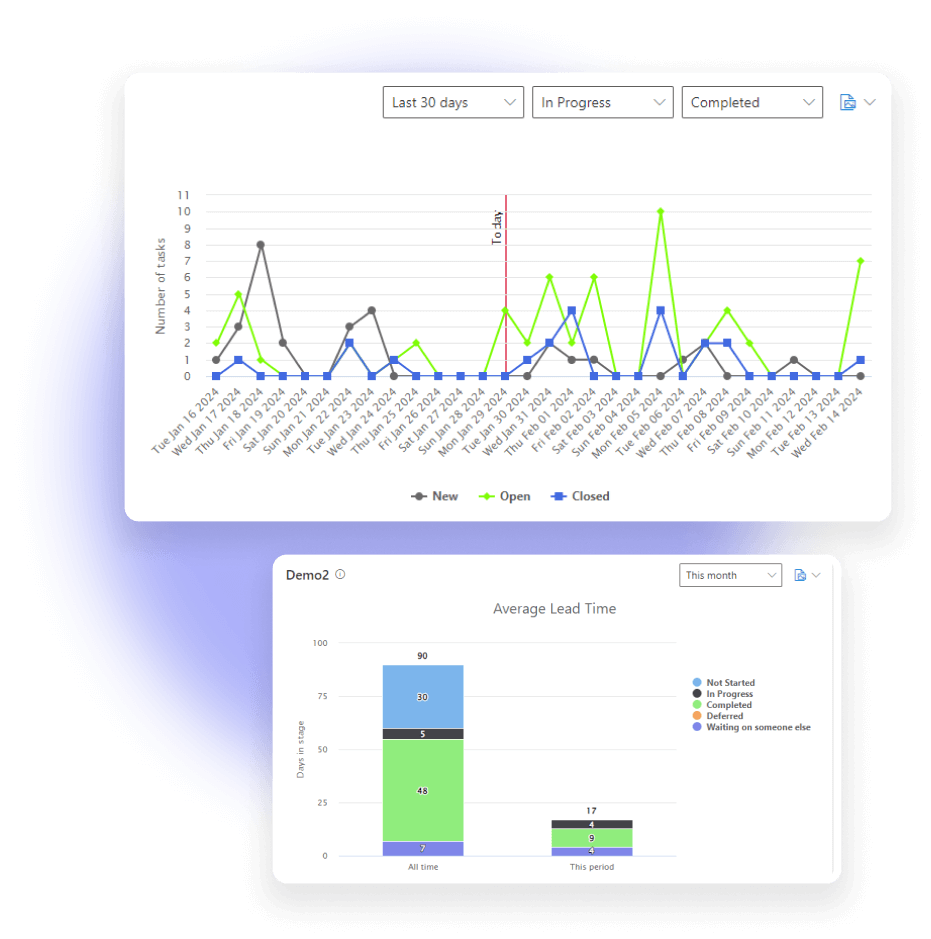
Burndown, completion and lead time charts show what is still open and where the project slips.
Trusted by Industry Leaders


and over 8,000 businesses worldwide
How it works
Real-Time Data Visualization
Provide up-to-the-minute insights for timely decision-making with data visualization capabilities.
Diverse Chart Options
Offer a variety of chart and dashboard formats within Teams to suit different objectives.
Work Progress and Bottleneck Identification
Use Completion and Burndown Charts to track project progress, pinpoint delays, and visualize outstanding tasks.
Good to know
Installation and documentation
Setup steps, video guides, FAQs and troubleshooting articles in our documentation.
Documentation →Deploy in your own Azure
Run the app in the Azure subscription linked to your Microsoft 365, under your control.
How it works →Your data
Your content stays in your Microsoft 365 tenant: the app processes it without storing it.
Trust & Security Center →
Talk to our team
Need clarity on our app's suitability for you? Set up a quick call with us or chat via Microsoft Teams chat to explore its potential for your needs.



Get Virto Charts & Data Visualization App Free
Download and extract the zip file to a folder on your SharePoint server.
Run Setup.exe under SharePoint administrator account and follow the simple wizard.
Download the Latest Version
Choose your SharePoint product version:
Need any help? — email us at support@virtosoftware.com