



Quick answer
To report on a SharePoint list, use grouped and filtered views for a fast built-in report, export to Excel for pivot tables and charts, or connect Power BI for interactive dashboards. Third-party add-ins can automate recurring, scheduled, and visual reports on top of your lists.
Presentation matters for any data source, and SharePoint lists are no exception. A list full of useful data is only valuable once you can present it clearly — and reports for stakeholders usually mean dashboards, KPIs, summaries, and charts rather than a raw grid of rows.
The good news: you don’t need a separate system to report on a SharePoint list. This 2026 guide covers four practical routes, from zero-setup built-in views to full Power BI dashboards, plus add-ins that automate recurring reports. Pick the one that matches how polished and how automated your report needs to be.
Four ways to report on a SharePoint list
| Method | Best for | Setup effort |
|---|---|---|
| Built-in views | Grouping, filtering and sorting inside SharePoint — a fast, no-cost report | None |
| Export to Excel | PivotTables, charts and offline analysis with a refreshable data connection | Low |
| Power BI | Interactive dashboards, KPIs and shareable reports for stakeholders | Medium (Pro/Fabric licence to share) |
| Reporting add-ins | Visual web parts and automated, recurring reports without leaving SharePoint | Low–medium |
Method 1. Build a report with custom SharePoint list views
SharePoint’s built-in view options are surprisingly capable. You can create custom views, filter and sort content, group rows, and even change how the whole page is displayed — all without any add-ons. Views come in two flavours: a personal view (just for you) and a public view (for everyone with access to the list, which needs the right permissions).
To start, open your SharePoint list and click the View options menu in the upper-right of the screen. It shows the current view type and the view name — usually All items by default.
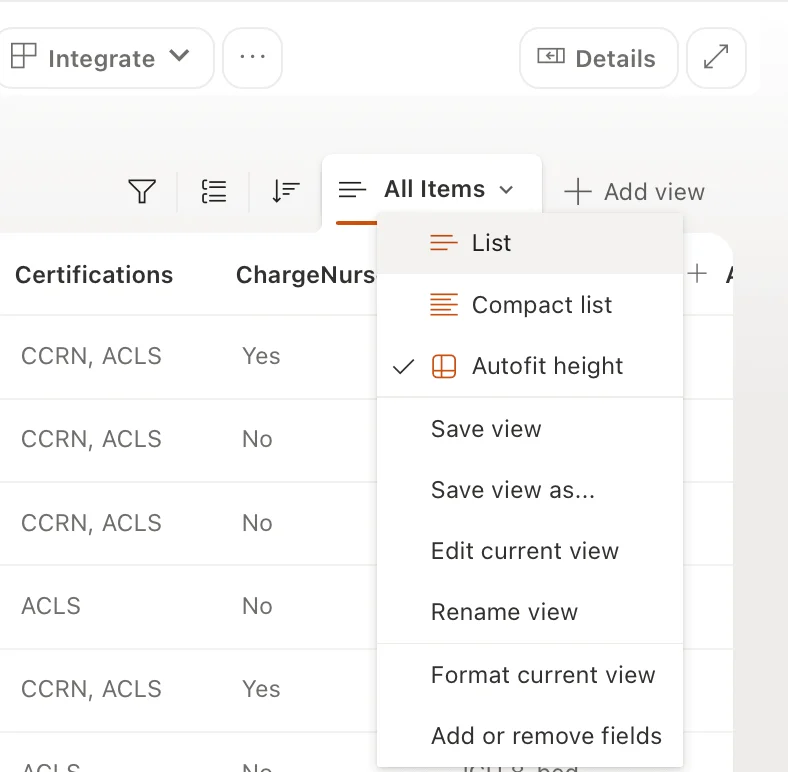
From this menu you can switch the view type between List, Gallery and Compact list, choose one of your saved views, or build a new one with Create new view and Save view as.
Beyond sorting a list alphabetically by a single column, you can filter to specific content with Filter by, or group rows together with Group by. Grouping by a status, owner or category column is often all a management report needs — it collapses hundreds of rows into a clean, countable summary.
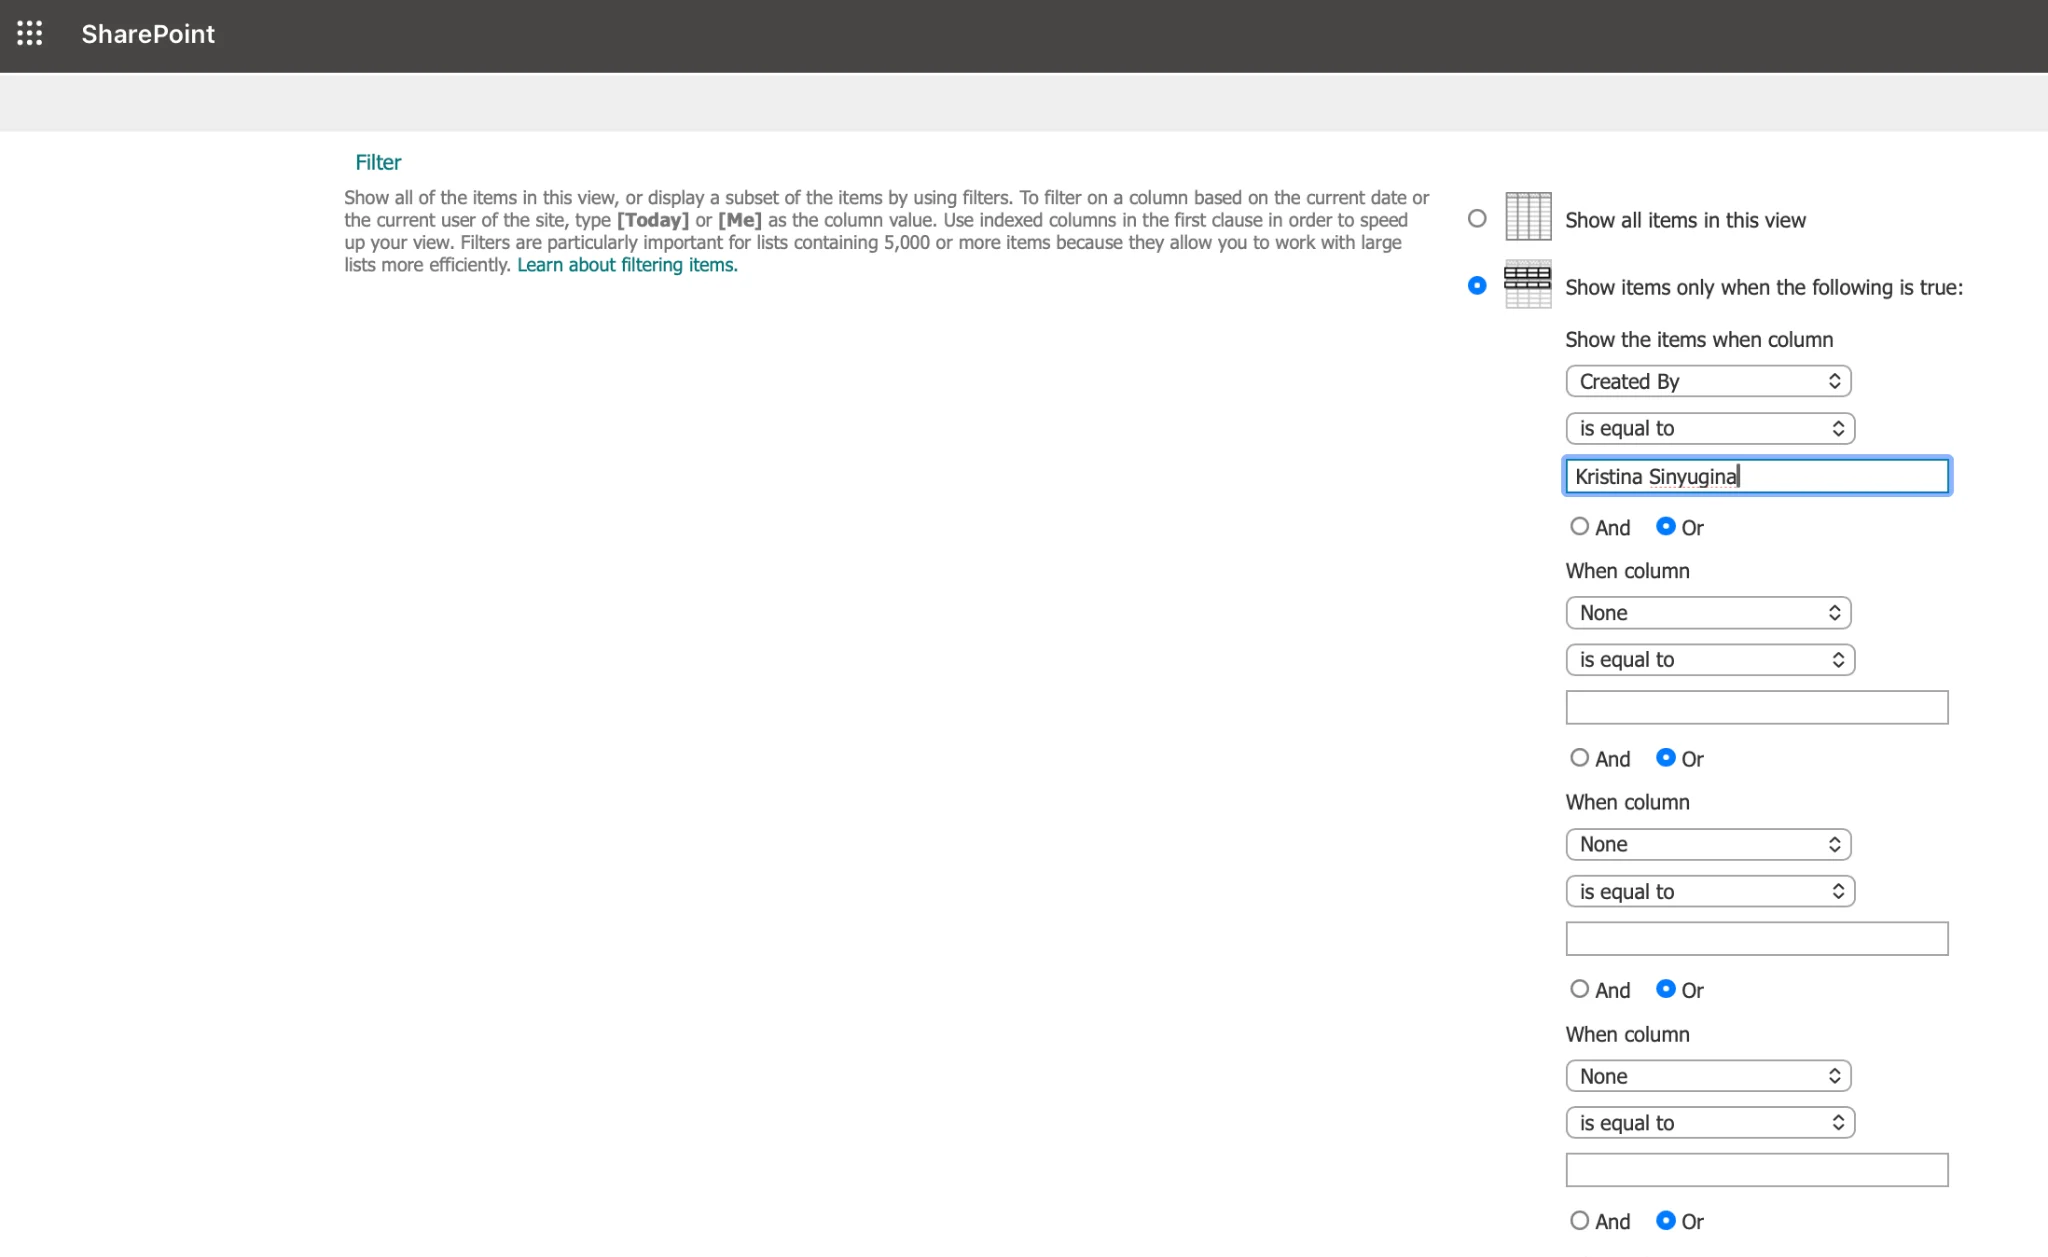
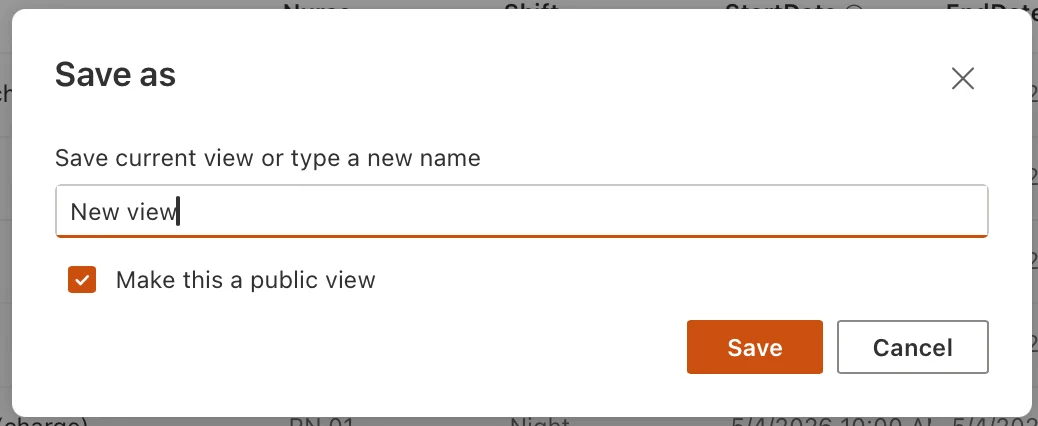
Once your filtering, sorting and grouping look right, save the arrangement as a view: open View options again, click Save view as, name it, and choose whether it is public or private. Technically, a well-built view is already a SharePoint list report — it presents the same data in a far more accessible way. When you need charts, trend lines and true dashboards, move on to Excel or Power BI.
Method 2. Export a SharePoint list to Excel
Excel is the quickest way to turn a list into charts, PivotTables and formatted reports. From the list command bar choose Export, then pick one of two options (see Microsoft’s Export to Excel from SharePoint or Lists guide for the full walkthrough):
- Export to Excel — downloads a small query.iqy file that opens Excel with a live, one-way connection to the list. Refresh the workbook and it pulls the latest data, so a report you build once stays current.
- Export to CSV — a static snapshot with no connection, capped at 30,000 rows. Use it for archives or feeding other tools.
With the data in Excel, insert a PivotTable to summarise by any field, add a PivotChart for visuals, and apply conditional formatting for KPIs. Because the .iqy connection is one-way, edits in Excel never write back to SharePoint — making it safe for reporting. Note that folder structures don’t transfer; SharePoint instead adds Item Type and Path columns.
Method 3. Build Power BI dashboards from a SharePoint list
Power BI is Microsoft’s business-analytics service, built to combine business intelligence with polished visuals in an interface most end users can navigate. It’s ideal for the dashboards, KPIs and gauges that stakeholder reports call for, and it integrates tightly with SharePoint.
The fastest route: Export to Power BI
2026 update: the entry point has moved. What used to sit under Integrate ▸ Power BI ▸ Visualize the list is now reached from the list command bar via Export ▸ Export to Power BI. SharePoint opens Power BI in a new tab, prompts you to name a semantic model and choose a workspace, and generates a starter report from your list.
From there, customise the report using the fields pane on the right — a single quick report shows up to four categories and three measures at a time; add or remove fields by ticking the boxes. For numeric fields, the Summarize control switches the aggregation between Average, Maximum, Minimum, Count, Variance, Median and more.
Use Edit for deeper changes, then Publish to save the report and share it with your team. One caution: switching a quick report into full edit mode is a one-way step — Power BI warns you before you commit.
For richer models: Power BI Desktop
When you need relationships across multiple lists, custom DAX measures or scheduled refresh, connect from Power BI Desktop using the SharePoint Online list connector. It gives you the full modelling and visualisation toolset before you publish to the service.
Licensing
Creating and viewing a report in your own workspace works on a free licence, but sharing a report or semantic model with colleagues — and viewing what others share — requires a Power BI Pro (or Premium/Fabric capacity) licence. Power BI has also been folded into Microsoft Fabric, so some menus now carry Fabric branding.
Method 4. Automate recurring reports with SharePoint add-ins
Built-in views, Excel and Power BI cover most one-off reporting. But if you need recurring reports — a weekly status board, an emailed digest, or a visual timeline that updates itself — a purpose-built add-in usually beats stitching the pieces together by hand.
Virto apps for SharePoint add reporting-friendly web parts that read straight from your existing lists. The Virto Kanban Board Web Part turns list items into a live, colour-coded board grouped by status or owner, and the Virto Gantt Chart Web Part renders task lists as a start-to-finish project timeline — both far more report-ready than a default grid.
Because they run natively inside SharePoint (Online and On-Premises), there’s nothing to export and no separate portal to manage. All Virto apps come with a 30-day free trial, so you can point one at a real list and see the report before committing.
What changed for SharePoint reporting in 2026
- The Power BI entry point moved from Integrate ▸ Visualize the list to Export ▸ Export to Power BI, and now creates a reusable semantic model.
- Power BI is part of Microsoft Fabric, so licensing and some menu labels reference Fabric capacity alongside Power BI Pro.
- Classic SharePoint Add-ins were retired on 2 April 2026. Modern SPFx web parts — including Virto’s — are unaffected and remain the supported way to extend lists.
- Power View is gone from Excel (removed from Microsoft 365 and Excel 2021); Power BI is its replacement. Some reporting features still differ between SharePoint Online and Server 2016/2019/Subscription Edition.
Frequently asked questions
What is the easiest way to create a report from a SharePoint list?
Build a custom view. Group and filter the list, save it as a public view, and you have a shareable report with zero setup or licensing. For charts, export the same list to Excel.
How do I create a Power BI report from a SharePoint list?
Open the list, choose Export ▸ Export to Power BI from the command bar, name the semantic model and pick a workspace. Power BI builds a starter report you can edit and publish. For advanced models, use the SharePoint Online list connector in Power BI Desktop.
Can I export a SharePoint list to Excel and keep it updated?
Yes. Export ▸ Export to Excel downloads a query file that opens Excel with a one-way live connection. Refreshing the workbook pulls the latest list data; CSV export, by contrast, is a static snapshot capped at 30,000 rows.
Do I need a paid licence to report on a SharePoint list?
No for built-in views and Excel export, and for building a Power BI report in your own workspace. Sharing a Power BI report or semantic model with others requires a Power BI Pro (or Fabric) licence.
How can I automate recurring SharePoint list reports?
Use a reporting add-in. Virto apps for SharePoint provide web parts — such as Kanban and Gantt views — that read live from your lists and refresh automatically, with a 30-day free trial to test on real data.
Does the old ‘Integrate’ menu still exist for Power BI?
The path changed in 2026. The former Integrate ▸ Power BI ▸ Visualize the list option is now reached through Export ▸ Export to Power BI, which creates a reusable semantic model rather than a one-off report.
Conclusion
Reporting on a SharePoint list is far from impossible — the challenge is picking the right level of effort. Custom views deliver a clean report in seconds, Excel adds pivots and charts, Power BI produces interactive dashboards for stakeholders, and add-ins automate the reports you run again and again. Match the method to your audience and how often the report needs to refresh, and a plain list becomes a genuine reporting tool.